Monitoring Stack – Part 3: Visualizing Server Metrics with Grafana Dashboards
In Part 2, we set up Node Exporter and Prometheus to gather and store metrics from our Linux server. In this post, we’ll focus on using Grafana to create meaningful, real-time dashboards from those metrics, allowing you to monitor your server’s performance at a glance.
Understanding Key Node Exporter Metrics
Node Exporter collects a wide range of system metrics. Here are some important ones you’ll likely want to include in your dashboards, along with an explanation of what they represent:
CPU Metrics
- Metric:
node_cpu_seconds_total - Description: Tracks CPU usage by mode (e.g., user, system, idle) and CPU core. This metric is cumulative, so PromQL functions are used to calculate usage rates.
- Useful Dashboard Panels: CPU usage over time (percentage), per-core breakdown.
Memory Metrics
- Metric:
node_memory_MemAvailable_bytes,node_memory_MemTotal_bytes - Description: Reports available and total memory. These metrics can help visualize used memory, available memory, and usage trends.
- Useful Dashboard Panels: Memory usage as a percentage, memory breakdown (used, available, cached, buffers).
Disk Usage Metrics
- Metric:
node_filesystem_avail_bytes,node_filesystem_size_bytes - Description: Shows available and total disk space for each mounted filesystem. You can monitor how much space is used and which filesystems are nearing capacity.
- Useful Dashboard Panels: Disk usage per filesystem, alerts for low space.
Disk I/O Metrics
- Metric:
node_disk_io_time_seconds_total,node_disk_reads_completed_total,node_disk_writes_completed_total - Description: Monitors I/O activity, showing the read/write operations completed and the time spent performing I/O operations.
- Useful Dashboard Panels: IOPS (Input/Output Operations per Second), read/write throughput, disk latency.
Network Metrics
- Metric:
node_network_receive_bytes_total,node_network_transmit_bytes_total - Description: Measures total bytes received and transmitted over network interfaces, helping track network throughput and usage.
- Useful Dashboard Panels: Network throughput over time, alerts for high bandwidth usage, packet drops.
Step-by-Step: Building a Server Monitoring Dashboard in Grafana
1. Panels for CPU Usage
Add a panel with the following PromQL query to show total CPU usage over time:
100 - (avg by (instance) (irate(node_cpu_seconds_total{mode="idle"}[5m])) * 100)
This query calculates the percentage of CPU used by subtracting the idle time from 100%.
Set the panel title to “CPU Usage (%)” and configure the display as a line graph or gauge.
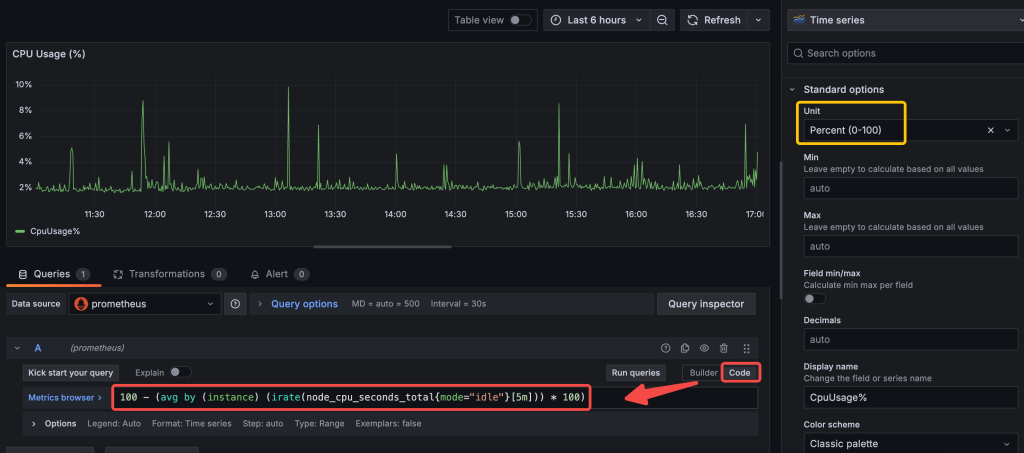
* Graph visualization could be selected like below.

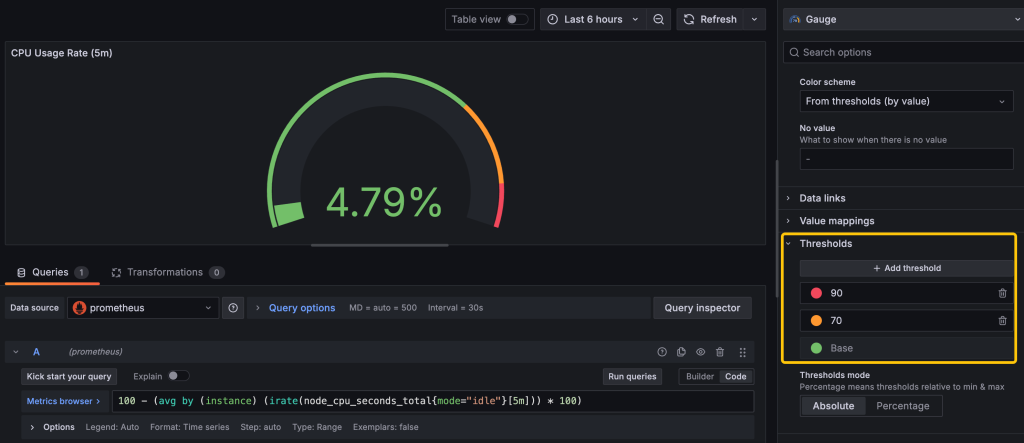
By setting up a gauge view, we can visualize the data on a scale out of 100, allowing for a clear, intuitive representation of the current value relative to the maximum.
Setting up thresholds also provides a powerful way to visually track metrics against critical limits, making it easy to identify and respond to data trends at a glance.
2. Panels for Memory Usage
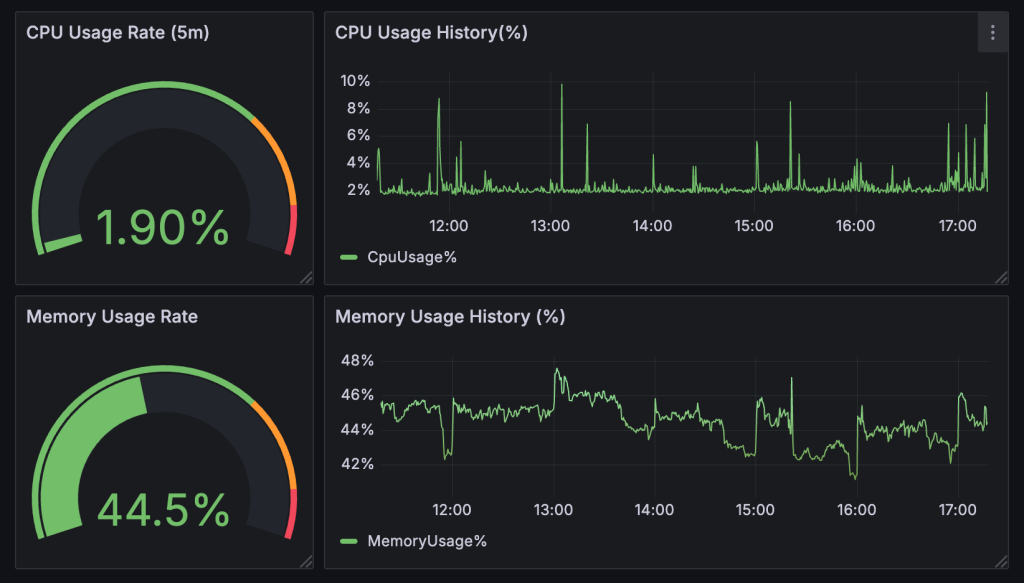
You can calculate memory usage as a percentage with:
100 * (1 - node_memory_MemAvailable_bytes / node_memory_MemTotal_bytes)
Just like in the CPU Usage panels, use a gauge or bar panel to display memory usage and set thresholds for critical levels (e.g., above 90% usage). By combining these panels, our dashboard becomes much clearer and more informative.
3. Panel for Disk Usage
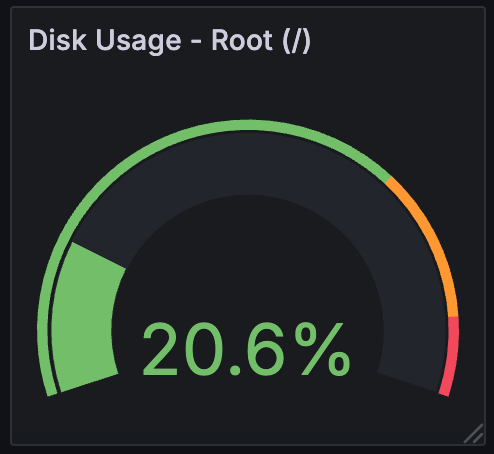
Add the Query for the Root Partition (/):
In the Prometheus query editor, use the following query to calculate the disk usage percentage for the root partition.
(node_filesystem_size_bytes{mountpoint="/"} - node_filesystem_avail_bytes{mountpoint="/"})
/ node_filesystem_size_bytes{mountpoint="/"} * 100
4. Panels for Disk I/O
Use lsblk command to idenfity your disk device name(s) first:

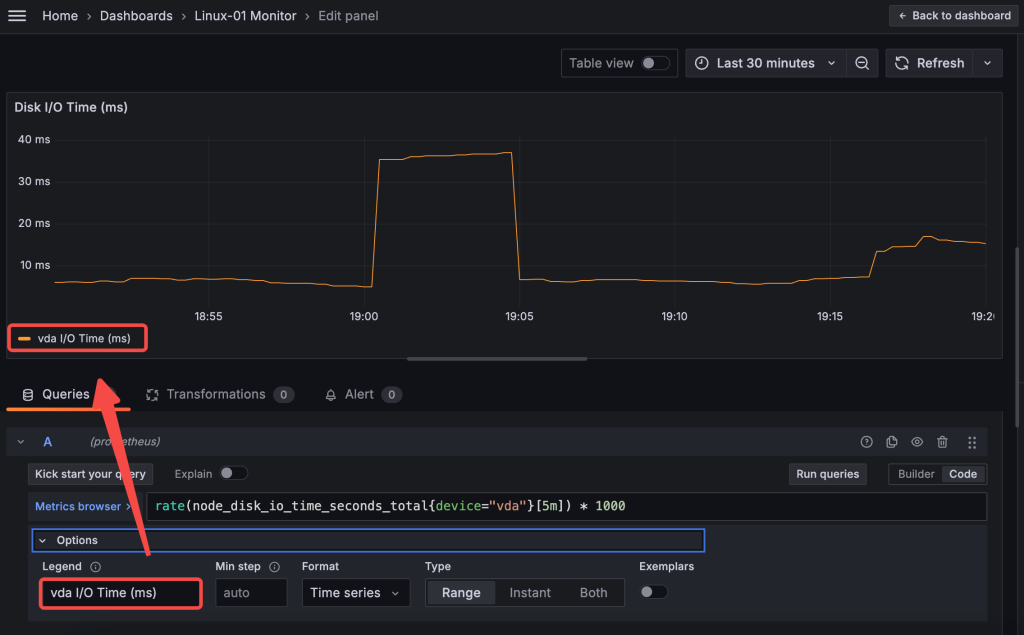
Disk I/O Time (in milliseconds)
This metric reflects how long each read or write operation takes, helping identify latency issues with the disk. In Prometheus, the metric node_disk_io_time_seconds_total is typically used.
rate(node_disk_io_time_seconds_total{device="<device_name>"}[5m]) * 1000
Remeber to replace the <device_name> with the disk device name you’ve quried in previous step.
Set the unit to milliseconds (ms) in Grafana to represent latency. Use a title like “Disk I/O Time (ms)”. Lastly, Time Series is best for viewing how latency changes over time.
Disk I/O Throughput (in KB/s)
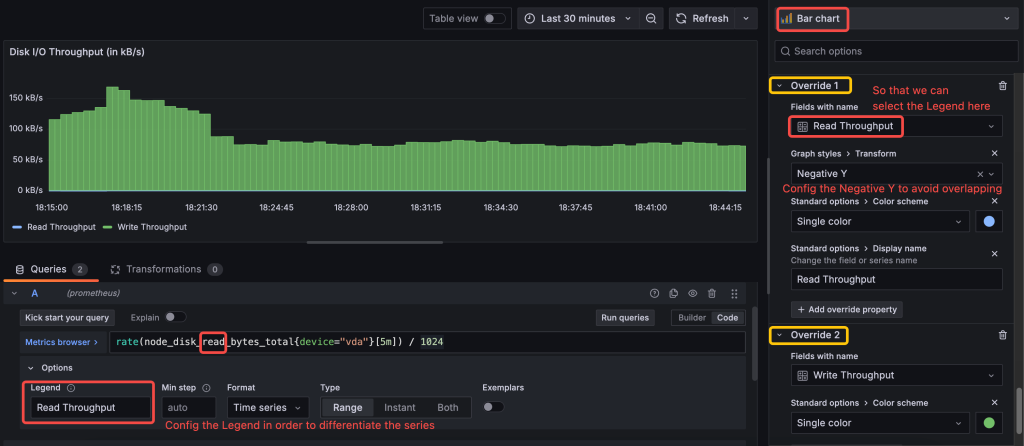
This metric measures the amount of data read or written over time, useful for monitoring data transfer rates. You can use node_disk_read_bytes_total and node_disk_written_bytes_total to track read and write volumes.
Query A (Read Throughput)
rate(node_disk_read_bytes_total{device="<device_name>"}[5m]) / 1024
Query B (Write Throughput)
rate(node_disk_written_bytes_total{device="<device_name>"}[5m]) / 1024
Ensure that each query is labeled distinctly in the Legend field (e.g., Read Throughput and Write Throughput). This will help Grafana differentiate between the two metrics.
5. Panel for System Uptime
This metric node_boot_time_seconds represents the system boot time in seconds since the epoch (i.e., Unix timestamp). By subtracting this value from the current time, you can calculate the system uptime.
To get the system’s uptime in seconds (or convert it to hours, days, etc.), use the following PromQL query:
(time() - node_boot_time_seconds) / 3600 / 24
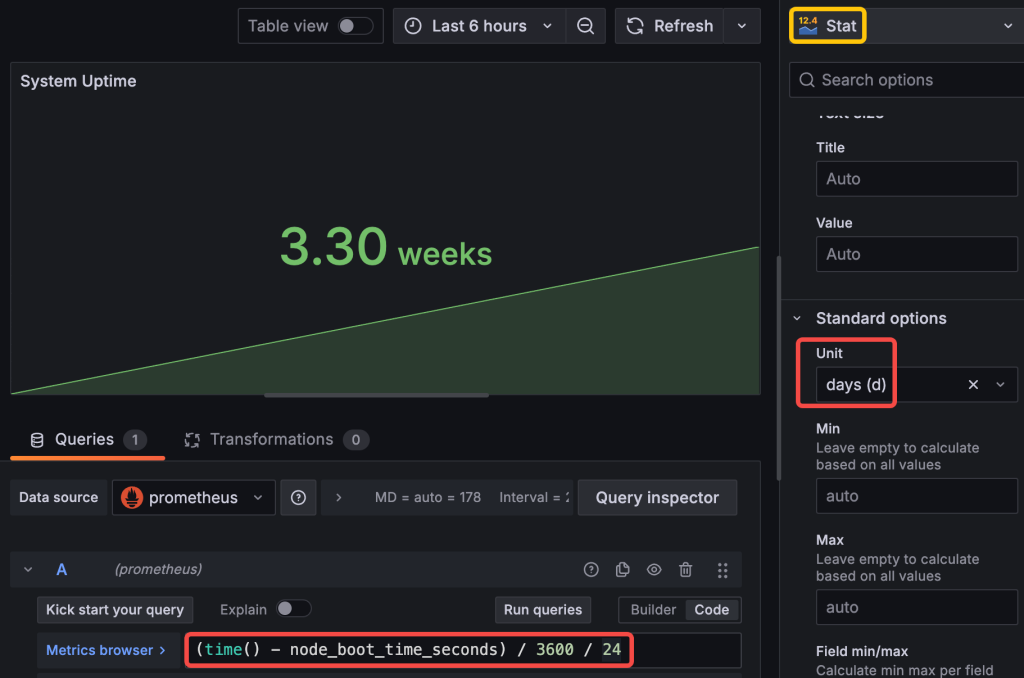
In the Panel Settings, set the Unit for the value. Select days (d) and as we’ve already converted the uptime unit to day in previous PromQL query.
6. Panel for Network Traffic
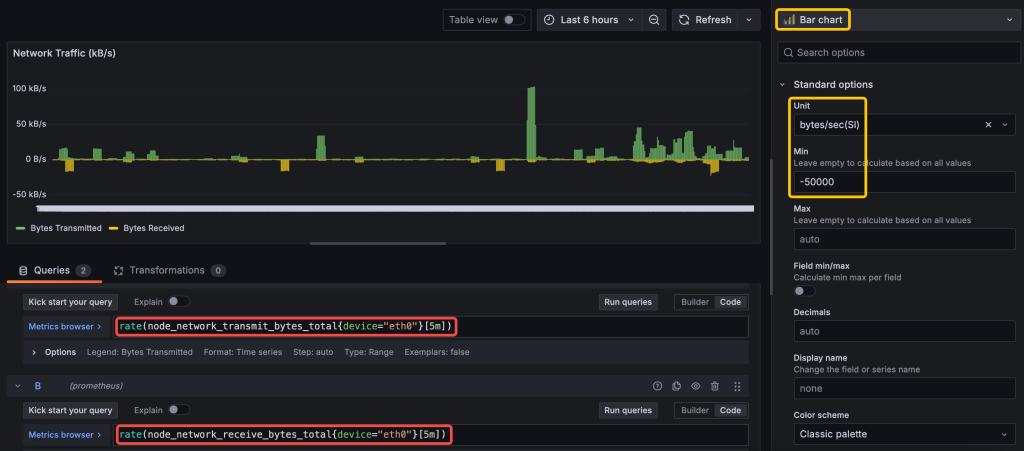
To monitor network throughput, use the following queries:
Bytes Received:
rate(node_network_receive_bytes_total{device="<device_name>"}[5m])
Bytes Transmitted:
rate(node_network_transmit_bytes_total{device="<device_name>"}[5m])
Since I only want to monitor external network traffic, so in my query I explicitly selects the eth0 interface, excluding the loopback (lo) or any other interfaces.
Final Dashboard Configuration Tips
- Use Variables: Add variables in Grafana (e.g., for
instanceormountpoint) to make your dashboard flexible and allow you to switch between instances or filesystems. - Choose Suitable Visualization Types: Use gauges for real-time metrics, bar charts for usage breakdowns, and line graphs for tracking changes over time.
- Optimize for Readability: Group similar metrics, add descriptive titles, and configure tooltips to make the dashboard intuitive and easy to read.
- Save and Reuse: Once your dashboard is configured, save it as a template for use on other servers or applications.
Conclusion
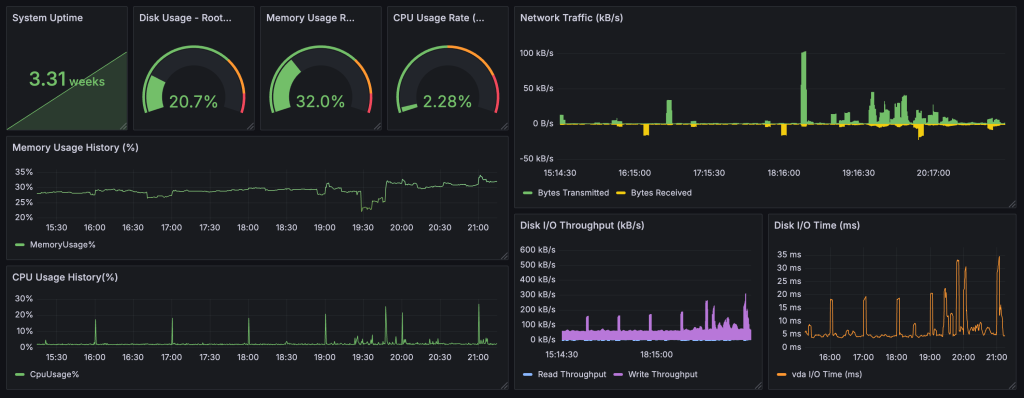
In this post, we explored key Node Exporter metrics and how to use them to build an effective server monitoring dashboard in Grafana. By visualizing metrics like CPU, memory, disk usage, and network traffic, you gain powerful insights into your server’s health and performance. This setup not only provides real-time visibility but also helps you proactively manage resources by setting up alerts.
In future posts, you could expand by adding custom application metrics or integrating additional services, such as MySQL or Apache, to monitor every part of your stack.