Capturing the HTTP trace using Fiddler / Browser F12
Capture the HTTP trace using Fiddler
1. Download Fiddler from the following link:
https://www.telerik.com/download/fiddler
2. Open Fiddler and close any unnecessary applications before proceeding.
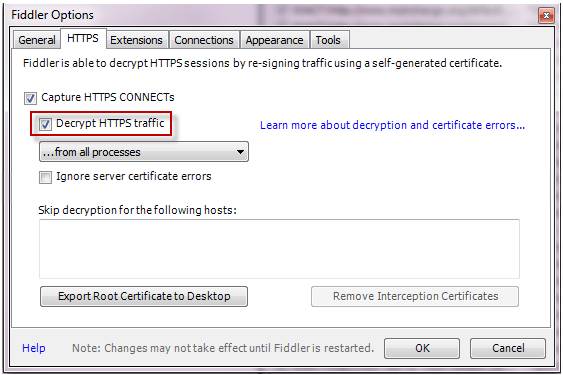
- Click on “Tools” in the menu bar, then select “Fiddler Options”.
- In the “Fiddler Options” window, click on the “HTTPS” tab.
- Check the “Decrypt HTTPS Traffic” box to enable HTTPS inspection.
Note: Make sure there is HTTPS traffic recorded in these traces, otherwise we cannot gain any insights.
3. Repro the issue you are encountering.
4. Stop capturing traffic in Fiddler and save the Fiddler trace.
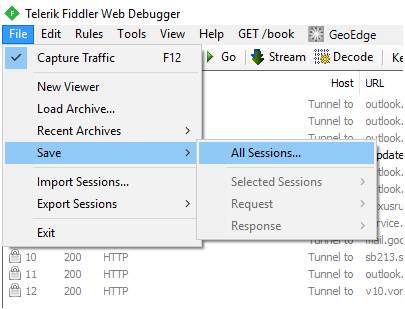
- Click on “File” in the menu bar and uncheck the “Capture Traffic” option (or press F12).
- Again, click on “File” and select “Save”. Choose “All Sessions” to save all captured sessions.
- You will see a new file with a *.saz extension, representing the saved Fiddler trace.
Capture the HTTP trace via Chrome Developer Tools – F12 key
It is a fallback method, in the situation that we cannot use the Fiddler.
The below doc also offers examples of performing HAR captures using various web browsers:
Capture a browser trace for troubleshooting – Azure portal | Microsoft Learn
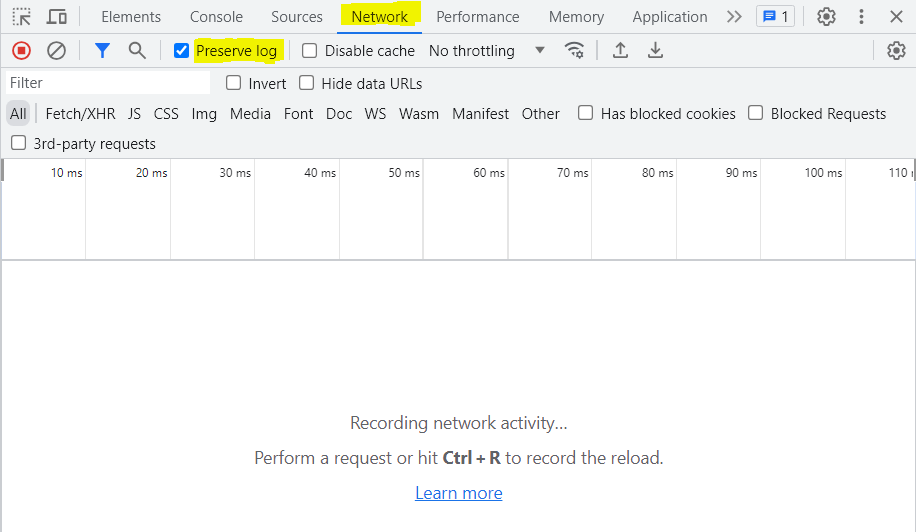
1. Press F12 Key in your keyboard > Open the “Network” tab in your browser’s developer tools.
2. Enable the “Preserve Log” option.
3. Repro the issue you are encountering.
4. Right-click any network entry and select “Save as HAR with content” > Save the HAR file.
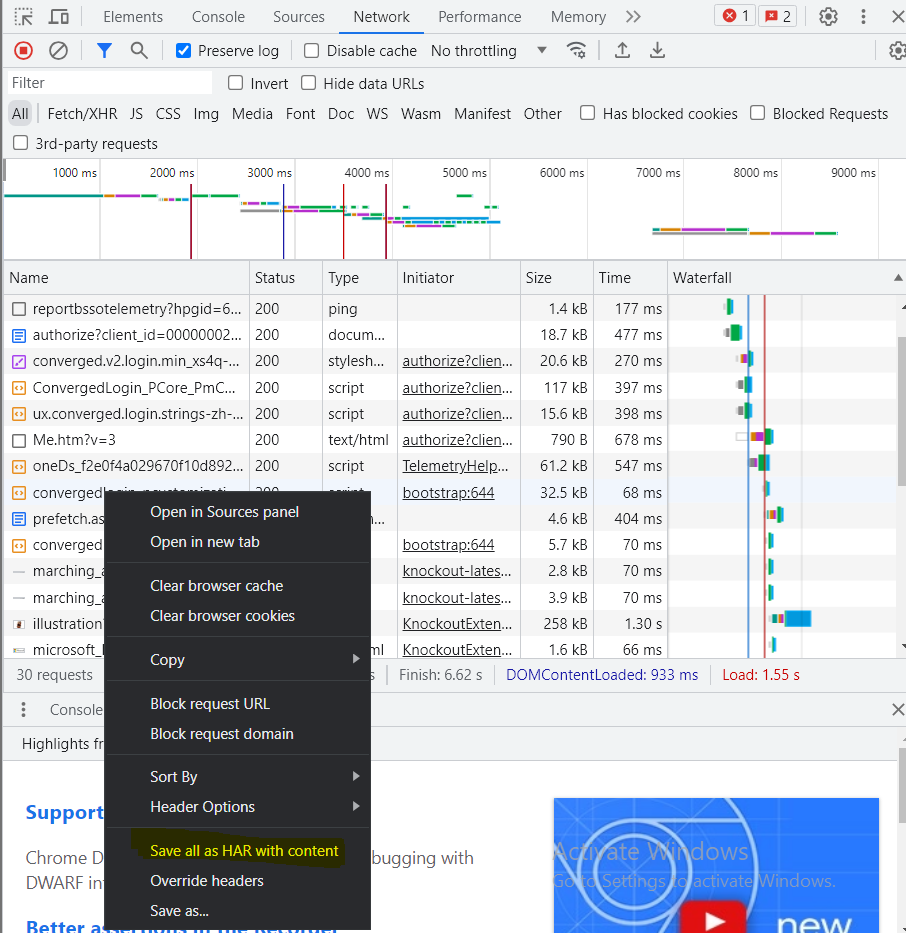
5. This HAR can be imported and viewed by Fiddler:
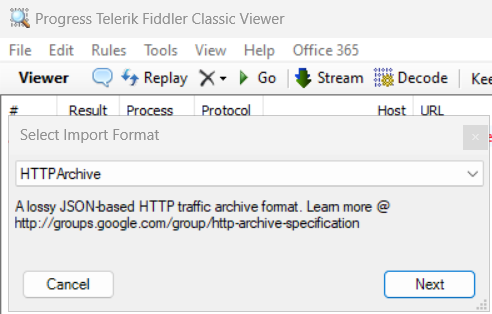
Go to “File” > “Import Sessions” > “HTTP Archive” > “Next“. Browse and select the saved HAR file.
