Monitoring Stack – Part 1: Setting Up Grafana on a Linux Server
Grafana provides powerful visualization tools for monitoring metrics. In this guide, I’ll show you how to set up Grafana on a Linux server without Docker, using a lightweight configuration with SQLite as the default database.

1. Add the Grafana Repository
To install Grafana from its official repository, start by adding it to your APT sources.
Create a new APT source file for Grafana:
sudo vi /etc/apt/sources.list.d/grafana.list
Add the following line and save the file:
deb [signed-by=/usr/share/keyrings/grafana-archive-keyring.gpg] https://packages.grafana.com/oss/deb stable main
Add Grafana’s GPG Key:
Import the GPG key to ensure that the repository is trusted.
curl https://packages.grafana.com/gpg.key | sudo gpg --dearmor -o /usr/share/keyrings/grafana-archive-keyring.gpg
Update the package list:
Refresh APT to include the new Grafana repository.
sudo apt-get update
2. Install SQLite (If Not Installed)
Grafana uses SQLite by default for data storage on single-server setups. Let’s ensure SQLite is installed.
Check if SQLite is installed:
sqlite3 --version
If you see a version number, you can skip to the next step.

If not, install SQLite with the command below.
Install SQLite:
sudo apt-get install sqlite3 -y
3. Install Grafana
With the repository and SQLite ready, you can now install Grafana.
sudo apt-get install grafana -y
4. Start and Enable Grafana
Start Grafana and enable it to run automatically at system startup.
sudo systemctl start grafana-server
sudo systemctl enable grafana-server
5. Configure Grafana to Use SQLite (Optional)
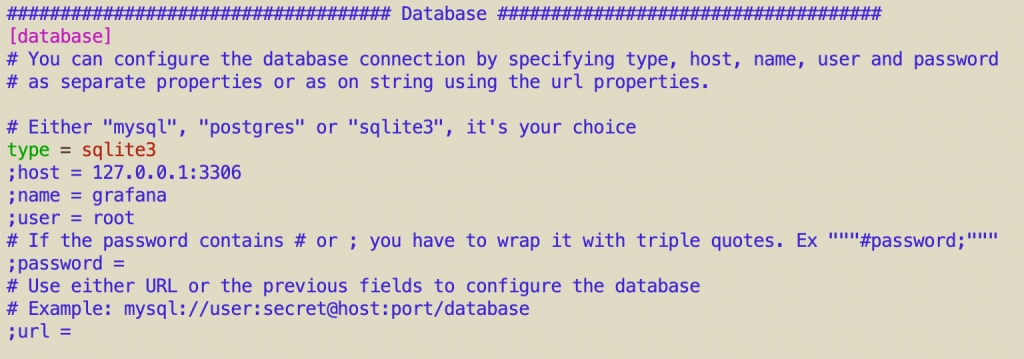
Grafana uses SQLite by default, but you can verify this configuration in the grafana.ini file.
Open the configuration file:
sudo vi /etc/grafana/grafana.ini
Locate the [database] section, and confirm it uses SQLite by setting the following option (remove any semicolon ; at the beginning to uncomment the line):
[database]
type = sqlite3
You can leave other parameters like host, name, user, and password commented out, as they are only required for MySQL or PostgreSQL.

Save and exit the file, and restart Grafana for any changes to take effect:
sudo systemctl restart grafana-server
6. Access Grafana in Your Browser
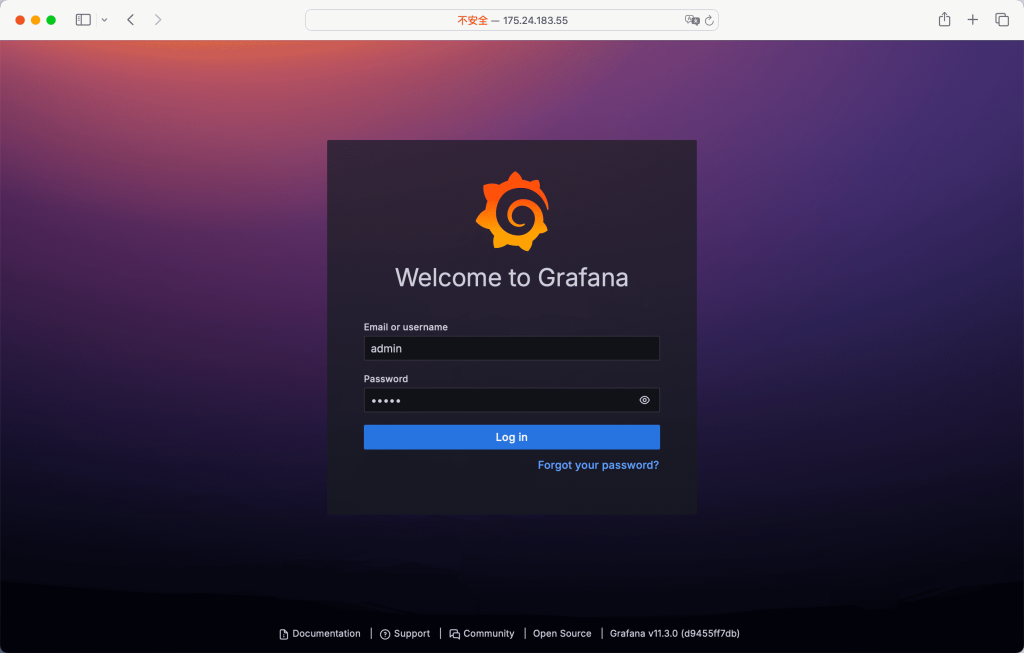
Visit http://your-server-ip:3000 in your web browser. The default login credentials are:
Username: admin
Password: admin
On the first login, you’ll be prompted to change the password for security.

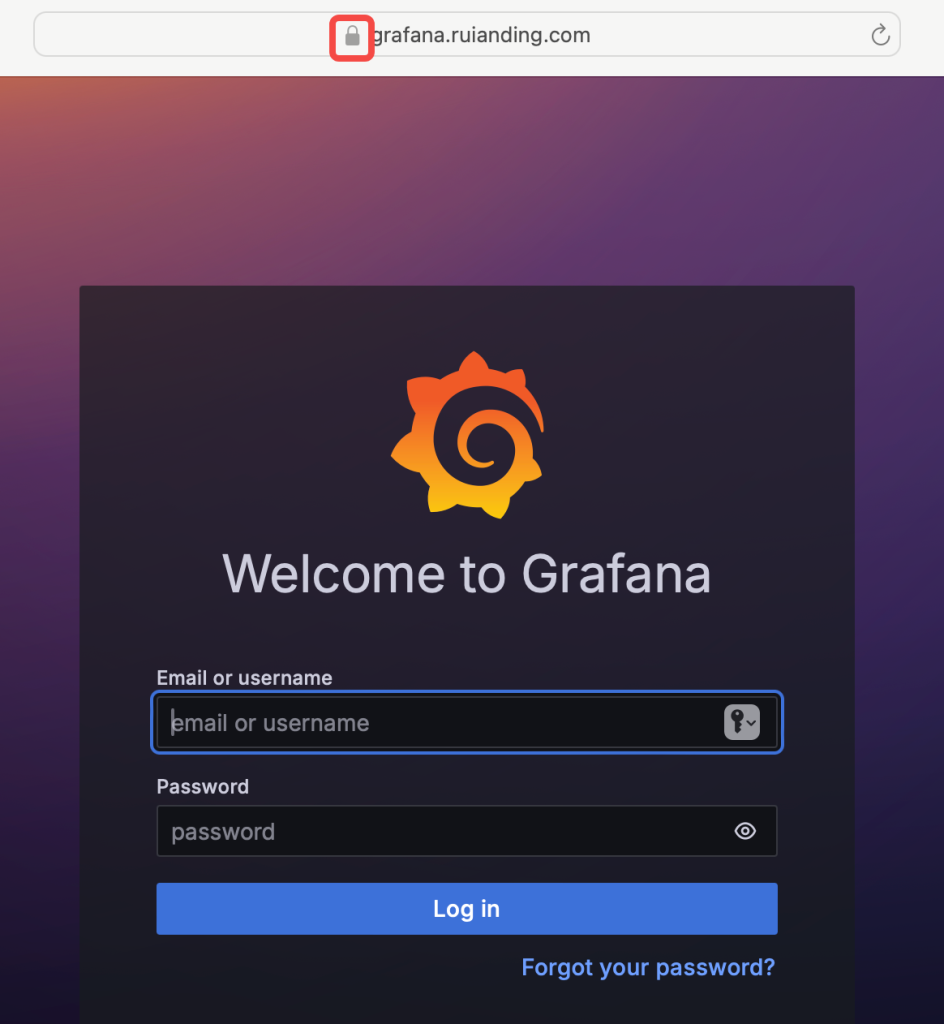
7. Secure the Connection with HTTPS
You can follow Step 4 in the post below to enable HTTPS with Certbot and set up a reverse proxy for the Grafana service.

Conclusion
With this setup, Grafana is ready for use on your Linux server. This guide provides a lightweight and efficient configuration ideal for single-server environments, allowing you to build real-time dashboards for monitoring and data visualization.