Monitoring Stack – Part 2: Building a Monitoring Stack with Node Exporter and Prometheus
In Part 1, we set up Grafana on a Linux server as a powerful visualization tool. Now, let’s complete our monitoring stack by adding Node Exporter and Prometheus to collect and store system metrics for Grafana to display.
In this guide, we’ll walk through installing and configuring Node Exporter to collect system metrics, Prometheus to store and serve those metrics, and finally, we’ll troubleshoot a common setup issue involving Prometheus’s storage directory.
Understanding the Components of a Monitoring Stack
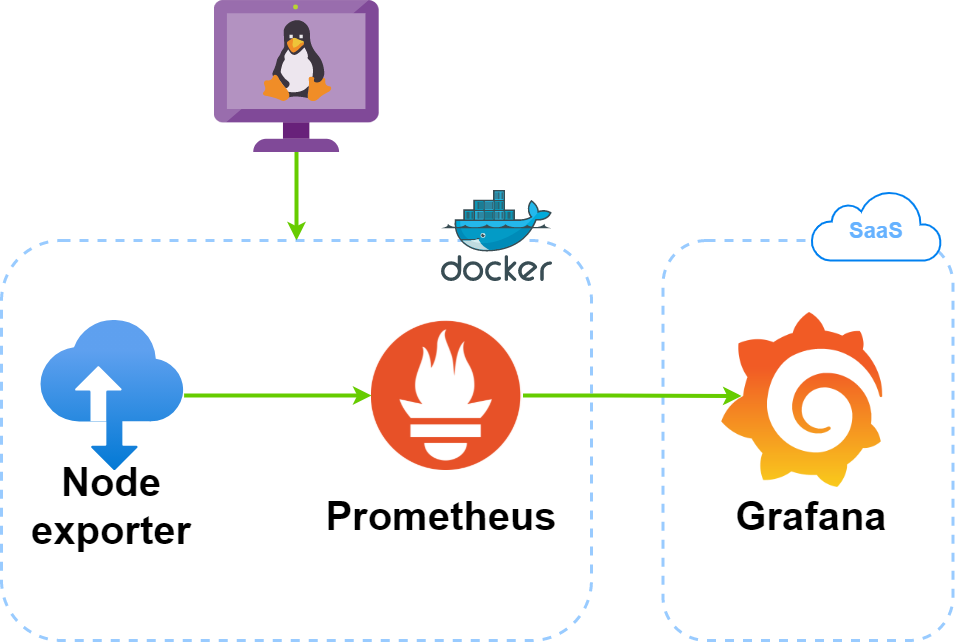
- Data Collector (Node Exporter): Gathers system-level metrics like CPU usage, memory utilization, and network stats from the server.
- Data Storage and Processing (Prometheus): Fetches metrics from Node Exporter and stores them, making the data available to Grafana for visualization.
- Data Visualization and Alerting (Grafana): Connects to Prometheus to visualize and monitor metrics.
Monitoring Workflow
- Node Exporter collects system resource metrics.
- Prometheus scrapes metrics from Node Exporter and stores them.
- Grafana reads data from Prometheus to visualize metrics and set up alerts.
This configuration allows Grafana to act as a “visualization layer” for all the data collected by Node Exporter and stored by Prometheus.
1. Setting Up Node Exporter
Download and Install Node Exporter:
curl -LO https://github.com/prometheus/node_exporter/releases/download/v1.3.1/node_exporter-1.3.1.linux-amd64.tar.gz
tar xvf node_exporter-1.3.1.linux-amd64.tar.gz
sudo mv node_exporter-1.3.1.linux-amd64/node_exporter /usr/local/bin/
Run Node Exporter as a Service:
sudo vi /etc/systemd/system/node_exporter.service
Insert this configuration:
[Unit]
Description=Node Exporter
After=network.target

[Service]
User=nobody
ExecStart=/usr/local/bin/node_exporter

[Install]
WantedBy=default.target
Start and Enable Node Exporter:
sudo systemctl daemon-reload
sudo systemctl start node_exporter
sudo systemctl enable node_exporter

Verify Node Exporter:
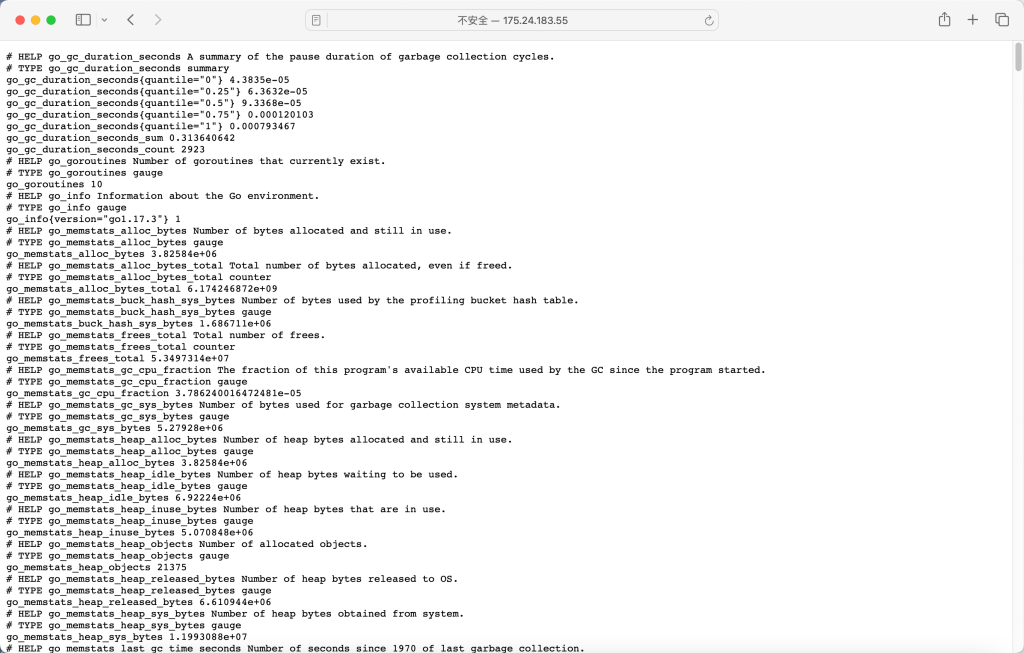
Visit http://your-server-ip:9100/metrics to confirm that metrics are exposed.
2. Setting Up Prometheus
Download and Install Prometheus:
curl -LO https://github.com/prometheus/prometheus/releases/download/v2.33.1/prometheus-2.33.1.linux-amd64.tar.gz
tar xvf prometheus-2.33.1.linux-amd64.tar.gz
sudo mv prometheus-2.33.1.linux-amd64/prometheus /usr/local/bin/
sudo mv prometheus-2.33.1.linux-amd64/promtool /usr/local/bin/
Configure Prometheus:
sudo mkdir -p /etc/prometheus
sudo vi /etc/prometheus/prometheus.yml
Add this configuration:
global:
  scrape_interval: 15s

scrape_configs:
  - job_name: 'node_exporter'
    static_configs:
      - targets: ['localhost:9100']
Set Up the Storage Directory:
Prometheus requires a data storage directory where it can write time-series data. This is a common setup issue if not configured.
Create the storage directory and set permissions: sudo mkdir -p /var/lib/prometheus sudo chown -R prometheus:prometheus /var/lib/prometheus
Add the --storage.tsdb.path parameter to the Prometheus service file to specify this directory.
Configure and Run Prometheus as a Service:
sudo vi /etc/systemd/system/prometheus.service
Add the following:
[Unit]
Description=Prometheus
After=network.target

[Service]
User=prometheus
ExecStart=/usr/local/bin/prometheus \
  --config.file=/etc/prometheus/prometheus.yml \
  --storage.tsdb.path=/var/lib/prometheus \
  --storage.tsdb.retention.time=7d

[Install]
WantedBy=default.target
Start and Enable Prometheus:
sudo systemctl daemon-reload
sudo systemctl start prometheus
sudo systemctl enable prometheus
Verify Prometheus:
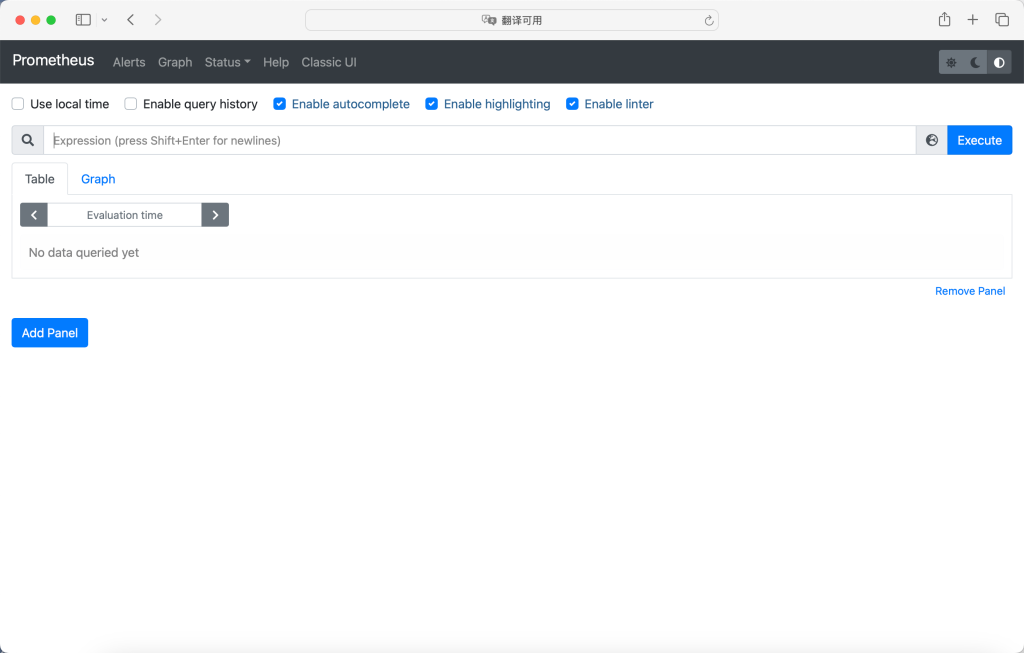
Visit http://your-server-ip:9090 to check the Prometheus UI.
Troubleshooting: Unable to Start Prometheus Due to “Unable to Create mmap-ed Active Query Log” Error
One common error when starting Prometheus is related to its storage directory:
Error Message: Unable to create mmap-ed active query log
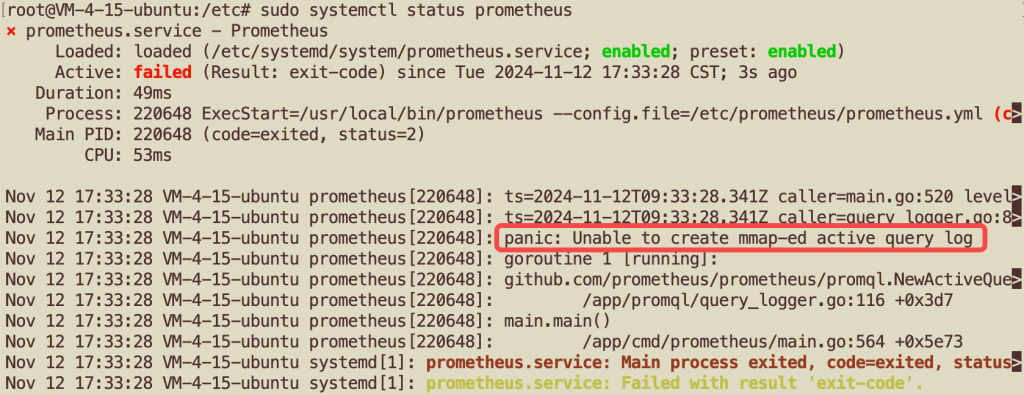
Solution: Ensure that Prometheus has write access to the specified storage directory (/var/lib/prometheus in this case) and that the --storage.tsdb.path parameter is included in the service file.

After setting the correct permissions and specifying the storage path, restart Prometheus to resolve the issue:
sudo systemctl daemon-reload
sudo systemctl restart prometheus
Connecting Prometheus to Grafana
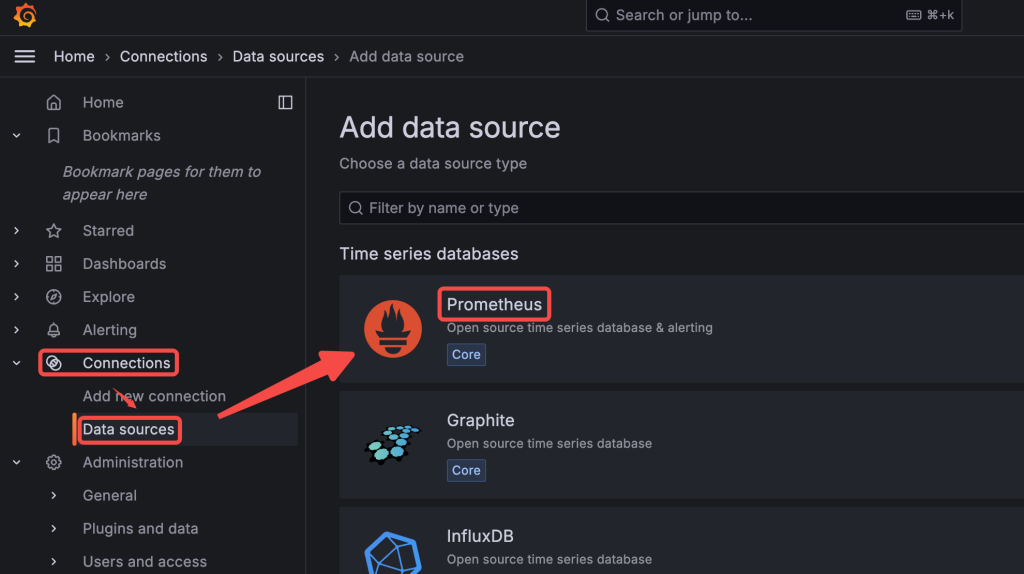
Add Prometheus as a Data Source in Grafana:
- Open Grafana.
- Go to Connections > Data Sources and click Add data source.
- Select Prometheus and enter
http://localhost:9090as the URL. - Click Save & Test.
Create Dashboards in Grafana:
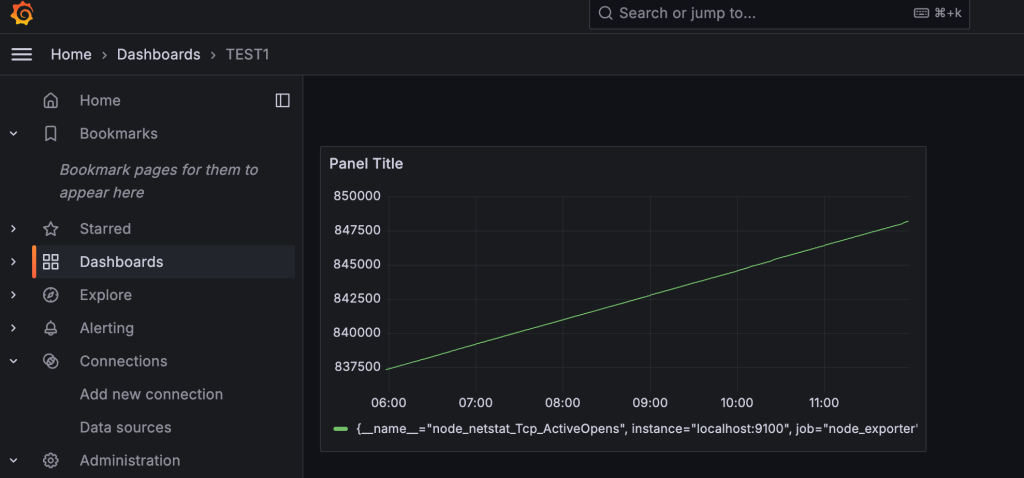
With Prometheus set as a data source, you can now create dashboards in Grafana using metrics from Node Exporter.
Summary
With Node Exporter and Prometheus, you now have a full monitoring stack:
- Node Exporter collects system-level metrics.
- Prometheus stores and serves metrics.
- Grafana visualizes data and enables alerting.
This setup provides a flexible and powerful monitoring solution, ideal for a variety of applications. Future posts could cover custom dashboards or setting up alerting rules to notify you when certain thresholds are met.