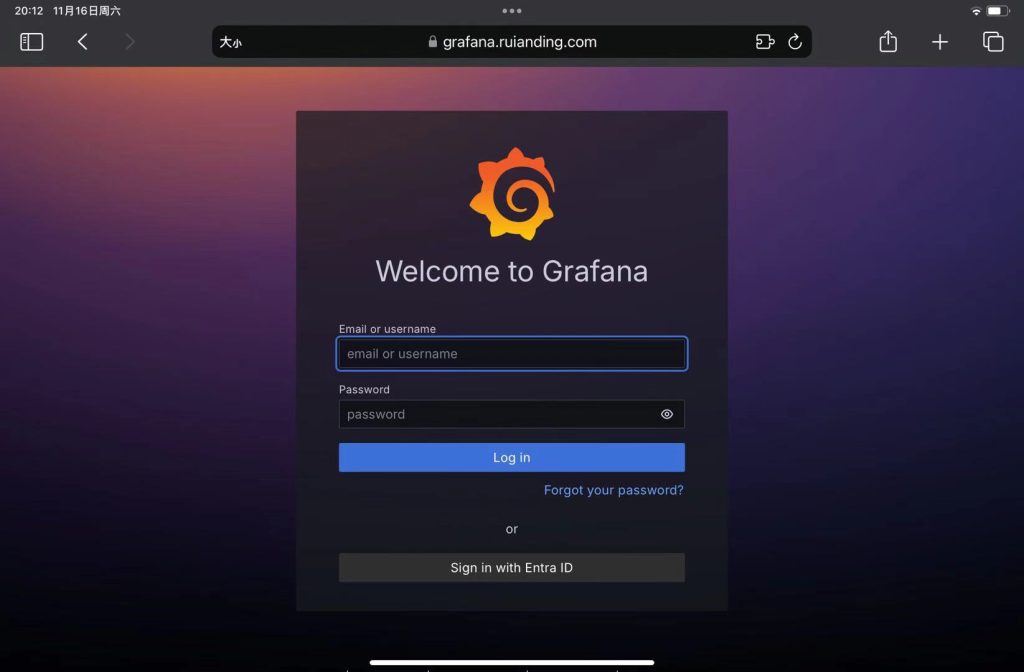
Resolving Grafana Compatibility Issues with iPadOS Safari
Recently, I encountered a peculiar issue while accessing Grafana on my iPad’s Safari browser. The page failed to load, displaying the error message: “Grafana has failed to load its application files”.
Interestingly, this issue was specific to my iPad mini (6th gen), as Grafana worked flawlessly on other devices like my Mac and iPhone using the same browser and configuration. After troubleshooting extensively, the problem was ultimately resolved by upgrading the iPadOS version.
The Problem
When attempting to load Grafana on iPad Safari, the following error appeared:
“Grafana has failed to load its application files”
The error suggested potential issues with reverse proxy settings, root_url or serve_from_sub_path configurations in grafana.ini, or even unsupported browsers.

Meanwhile, the same Grafana instance worked perfectly on other devices, including Safari on macOS and iOS.
I aslo thought it make realted to supported browser, so I downloaded the Chrome, but with no luck:

Troubleshooting Steps
- Reverse Proxy Settings:
I verified the Apache reverse proxy configuration, including WebSocket support and URL forwarding, and confirmed everything was correctly set. - Grafana Configuration:
Checked thegrafana.inifile to ensure that the[server]section had the correctroot_urlandserve_from_sub_pathvalues. - iPad Network and Cache:
Cleared Safari’s cache on the iPad and switched to different networks, but the issue persisted. - Browser Compatibility:
Verified that Safari was on the list of supported browsers for Grafana, but this offered no further insights.
The Solution
Eventually, I came across a related GitHub issue where users described similar behavior. The discussion highlighted that certain versions of iPadOS Safari might exhibit undefined behavior when interacting with Grafana.

The breakthrough came after upgrading my iPadOS to 17.7.1, which resolved the issue completely. Grafana loaded successfully without any further adjustments to the configuration.

Key Takeaways
If you encounter similar issues with Grafana on iPad Safari, consider the following steps:
- Verify the reverse proxy and Grafana configurations, ensuring
root_urlandserve_from_sub_pathare set correctly. - Clear Safari’s cache and test on a stable network.
- If the issue persists, update your iPadOS to the latest version.
This experience underscores the importance of keeping both system software and applications up to date to avoid compatibility issues. Hope this post helped you.